Integrating Bodo with Front-End Tools
Bodo can be integrated with front-end tools to build real-time analytics dashboards. This page provides a walk-through of creating a Streamlit app with Bodo on your laptop or VM.
All the code referenced on this page is available here, and the steps to running the app are provided below.
The Taxi Pickup App
This app is based on a demo from the official Streamlit documentation, which explores a public Uber dataset for pickups and drop-offs in New York City.
We will essentially read a parquet file into a dataframe,
convert the string date/time column to datetime data,
and return the dataframe to be plotted in the app:
def load_data_pandas(pq_file_path, date_col='date/time'):
    data = pd.read_parquet(pq_file_path)
    data[date_col] = pd.to_datetime(data[date_col])
    return data
Bodo version of the Taxi Pickup App
To run the app using Bodo, we will use the same process as running the
app on an IPyParallel cluster. For this app, we want to visualize all the data, so in the
Bodo version of this function, we disable automatic data distribution
using the returns_maybe_distributed flag, and use bodo.gatherv to
gather all the data onto a single process:
@bodo.jit(returns_maybe_distributed=False, cache=True)
def load_data_bodo(pq_file_path, date_col='date/time'):
    data = pd.read_parquet(pq_file_path)
    data[date_col] = pd.to_datetime(data[date_col])
    return bodo.gatherv(data)
We define a Python wrapper for load_data_bodo called build_main:
def build_main(pq_file_path, date_col='date/time'):
    op_df = load_data_bodo(pq_file_path, date_col='Date/Time')
    return op_df
Finally, we need a function to send the imports and code definitions to
the mpi engines, call the load_data_bodo function, and then return the
result to the client:
def initialize_bodo(pq_file_path, date_col='date/time'):

    t0 = time.time()

    client = ipp.Client(profile='mpi')
    dview = client[:]
    # import libraries
    dview.execute("import numpy as np")
    dview.execute("import pandas as pd")
    dview.execute("import bodo")
    dview.execute("import time")
    dview.execute("import os")
    dview.execute("import datetime as dt")
    dview.execute("import sys")

    bodo_funcs = [load_data_bodo]

    for f in bodo_funcs:
        # get source code of Bodo function
        f_src = inspect.getsource(f)
        # execute the source code thereby defining the function on engines
        dview.execute(f_src).get()

    op_df = dview.apply(build_main, pq_file_path, 'Date/Time').get()

    t1 = time.time()
    print("Total Exec + Compilation time:", t1-t0)
    client.close()

    return op_df[0]
Building the Streamlit Visualization
We create the Streamlit App by adding the title, creating some headers and printing out some basic information about our app:
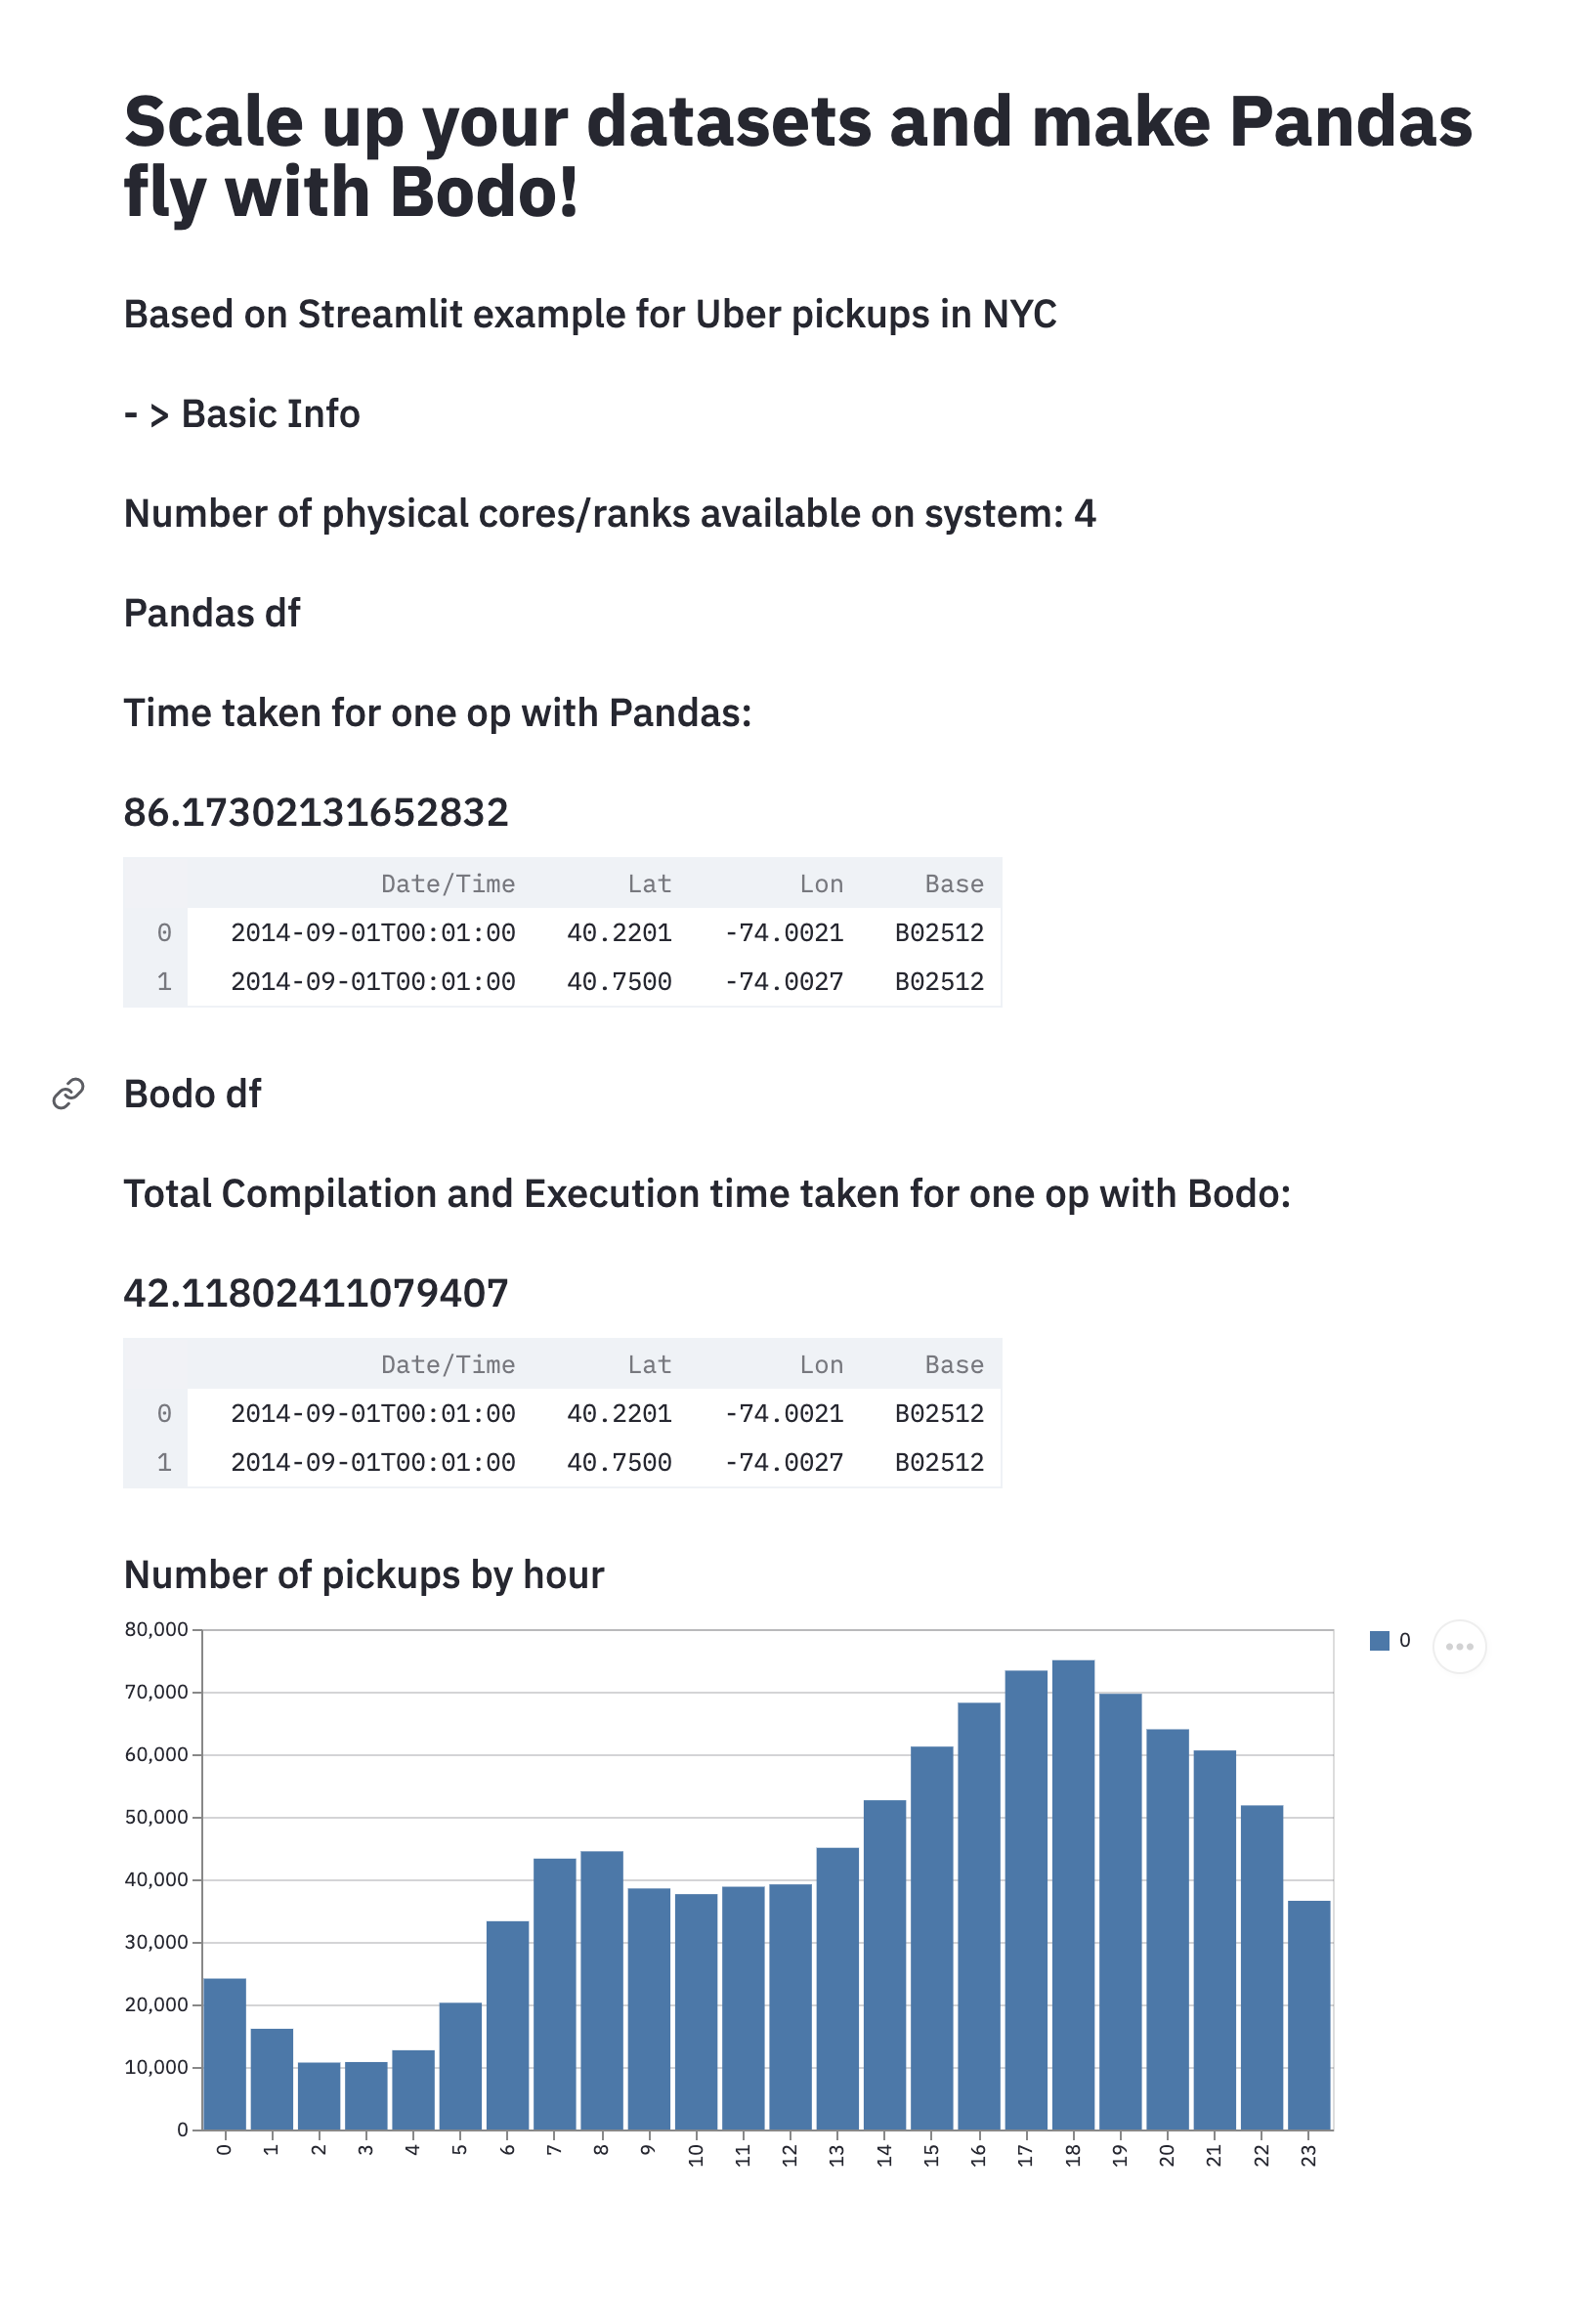
st.title('Scale up your datasets and make Pandas fly with Bodo!')
st.subheader('Based on Streamlit example for Uber pickups in NYC')
st.subheader(' - > Basic Info')
st.subheader('Number of physical cores/ranks available on system: %s' % psutil.cpu_count(logical=False))
We first run the Pandas app and see how long it takes:
t0 = time.time()
pdf = load_data_pandas(pq_file_path, date_col='Date/Time')
t1 = time.time()
st.subheader('Pandas df')
st.subheader('Time taken for one op with Pandas:')
st.subheader(t1-t0)
st.write(pdf.head(2)) # print two rows to check output.
We do the same with Bodo:
t2 = time.time()
bdf = initialize_bodo(pq_file_path, date_col='Date/Time')
t3 = time.time()
st.subheader('Bodo df')
st.subheader('Total Compilation and Execution time taken for one op with Bodo:')
st.subheader(t3-t2)
st.write(bdf.head(2))
We can also visualize the data in a histogram showing the pickups by hour:
DATE_COLUMN = 'date/time'
lowercase = lambda x: str(x).lower()
bdf.rename(lowercase, axis='columns', inplace=True)
st.subheader('Number of pickups by hour')
hist_values = np.histogram(bdf[DATE_COLUMN].dt.hour, bins=24, range=(0,24))[0]
st.bar_chart(hist_values)
Running the Taxi Pickup App
Clone the Bodo Examples
repository and navigate to the streamlit directory. The
directory has the following structure:
streamlit
├── README.md
├── app.py
├── config.py
├── environment.yml
├── pd_vs_Bodo.png
├── sample_parquet_file.pq
We have provided an environment.yml file to create a conda environment
with all the required dependencies. The app code is stored in app.py,
and some configuration parameters such as the input file, and path to
current directory are set in config.py. We have provided a sample
parquet file sample_parquet_file.pq to test the app with.
Note
Please ensure that the path to current directory is set in the
config.py file.
Start the IPyParallel controller and engines
Create a conda environment from the provided environment.yml file, and
activate the conda environment:
Append the current directory to your Python Path:
Now you can start ipcontroller: Open a new terminal and activate thestlbodo conda environment. You
will need to append the current directory to your Python Path again. Use
the following command to start a set of MPI engines:
mpiexec -n 4 python -m ipyparallel.engine --mpi --profile-dir ~/.ipython/profile_mpi --cluster-id '' --log-level=DEBUG
Run the Streamlit App
Open another terminal and activate the stlbodo conda environment.
Navigate to the streamlit directory, and then run:
You should now be able to open up the app in a browser window and see the output for yourself. Note that it will take roughly around one and a half minute for the Pandas output to show up, and including compilation time, and following that, less than a minute for for the Bodo output and visualization to show up.
If you face any issues while running the app, please let us know through our Feedback repository, or join our community slack to communicate directly with Bodo engineers.