Data Visualization
Bodo supports Matplotlib visualization natively inside JIT functions. This section specifies the supported Matplotlib APIs and classes. In general, these APIs support all arguments except for the restrictions specified in each section.
Plotting APIs
Currently, Bodo automatically supports the following plotting APIs.
matplotlib.pyplot.plotmatplotlib.pyplot.scattermatplotlib.pyplot.barmatplotlib.pyplot.contourmatplotlib.pyplot.contourfmatplotlib.pyplot.quivermatplotlib.pyplot.pie(autopctmust be a constant boolean or omitted)matplotlib.pyplot.fillmatplotlib.pyplot.fill_betweenmatplotlib.pyplot.stepmatplotlib.pyplot.errorbarmatplotlib.pyplot.barbsmatplotlib.pyplot.eventplotmatplotlib.pyplot.hexbinmatplotlib.pyplot.xcorr(autopctmust be a constant boolean or omitted)matplotlib.pyplot.imshowmatplotlib.pyplot.plotmatplotlib.pyplot.scattermatplotlib.pyplot.barmatplotlib.axes.Axes.contourmatplotlib.axes.Axes.contourfmatplotlib.axes.Axes.quivermatplotlib.axes.Axes.pie(usevlinesmust be a constant boolean or omitted)matplotlib.axes.Axes.fillmatplotlib.axes.Axes.fill_betweenmatplotlib.axes.Axes.stepmatplotlib.axes.Axes.errorbarmatplotlib.axes.Axes.barbsmatplotlib.axes.Axes.eventplotmatplotlib.axes.Axes.hexbinmatplotlib.axes.Axes.xcorr(usevlinesmust be a constant boolean or omitted)matplotlib.axes.Axes.imshow
These APIs have the following restrictions:
- The data being plotted must be Numpy arrays and not Pandas data structures.
- Use of lists is not currently supported. If you need to plot multiple arrays use a tuple or a 2D Numpy array.
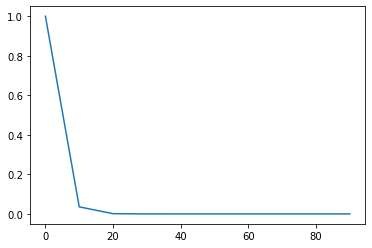
These functions work by automatically gathering all of the data onto one machine and then plotting the data. If there is not enough memory on your machine, a sample of the data can be selected. The example code below demonstrates calling plot with a sample of the data:
import matplotlib.pyplot as plt

%matplotlib inline

@bodo.jit
def dist_plot(n):
    X = np.arange(n)
    Y = np.exp(-X/3.0)
    plt.plot(X[::10], Y[::10]) # gather every 10th element
    plt.show()

dist_plot(100)
Formatting APIs
In addition to plotting, we also support a variety of formatting APIs to modify your figures.
matplotlib.pyplot.gcamatplotlib.pyplot.gcfmatplotlib.pyplot.textmatplotlib.pyplot.subplots(nrowsandncolsmust be constant integers)matplotlib.pyplot.suptitlematplotlib.pyplot.tight_layoutmatplotlib.pyplot.savefigmatplotlib.pyplot.drawmatplotlib.pyplot.show(Output is only displayed on rank 0)matplotlib.figure.Figure.suptitlematplotlib.figure.Figure.tight_layoutmatplotlib.figure.Figure.subplots(nrowsandncolsmust be constant integers)matplotlib.figure.Figure.show(Output is only displayed on rank 0)matplotlib.axes.Axes.annotatematplotlib.axes.Axes.textmatplotlib.axes.Axes.set_xlabelmatplotlib.axes.Axes.set_ylabelmatplotlib.axes.Axes.set_xscalematplotlib.axes.Axes.set_yscalematplotlib.axes.Axes.set_xticklabelsmatplotlib.axes.Axes.set_yticklabelsmatplotlib.axes.Axes.set_xlimmatplotlib.axes.Axes.set_ylimmatplotlib.axes.Axes.set_xticksmatplotlib.axes.Axes.set_yticksmatplotlib.axes.Axes.set_axis_onmatplotlib.axes.Axes.set_axis_offmatplotlib.axes.Axes.drawmatplotlib.axes.Axes.set_titlematplotlib.axes.Axes.legendmatplotlib.axes.Axes.grid
In general these APIs support all arguments except for the restrictions specified. In addition, APIs have the following restrictions:
- Use of lists is not currently supported. If you need to provide a list, please use a tuple instead.
- Formatting functions execute on all ranks by default. If you need to execute further Matplotlib code on all of your processes, please close any figures you opened inside Bodo.
Matplotlib Classes
Bodo supports the following Matplotlib classes when used with the previously mentioned APIs:
matplotlib.figure.Figurematplotlib.axes.Axesmatplotlib.text.Textmatplotlib.text.Annotationmatplotlib.lines.Line2Dmatplotlib.collections.PathCollectionmatplotlib.container.BarContainermatplotlib.contour.QuadContourSetmatplotlib.quiver.Quivermatplotlib.patches.Wedgematplotlib.patches.Polygonmatplotlib.collections.PolyCollectionmatplotlib.image.AxesImagematplotlib.container.ErrorbarContainermatplotlib.quiver.Barbsmatplotlib.collections.EventCollectionmatplotlib.collections.LineCollection
Working with Unsupported APIs
For other visualization functions, you can call them from regular Python and manually gather the data. If the data does not fit in a single machine's memory, you may need to take a sample. The example code below demonstrates gathering a portion of data in Bodo and calling polar (which Bodo doesn't support yet) in regular Python:
import bodo
import numpy as np
import matplotlib.pyplot as plt

@bodo.jit()
def dist_gather_test(n):
    X = np.arange(n)
    Y = 3 - np.cos(X)
    return bodo.gatherv(X[::10]), bodo.gatherv(Y[::10])  # gather every 10th element

X_Sample, Y_Sample = dist_gather_test(1000)
if bodo.get_rank() == 0:
    plt.polar(X_Sample, Y_Sample)
    plt.show()